
Average Room Rate (ARR): Formula, Calculator & Guide for Hotels
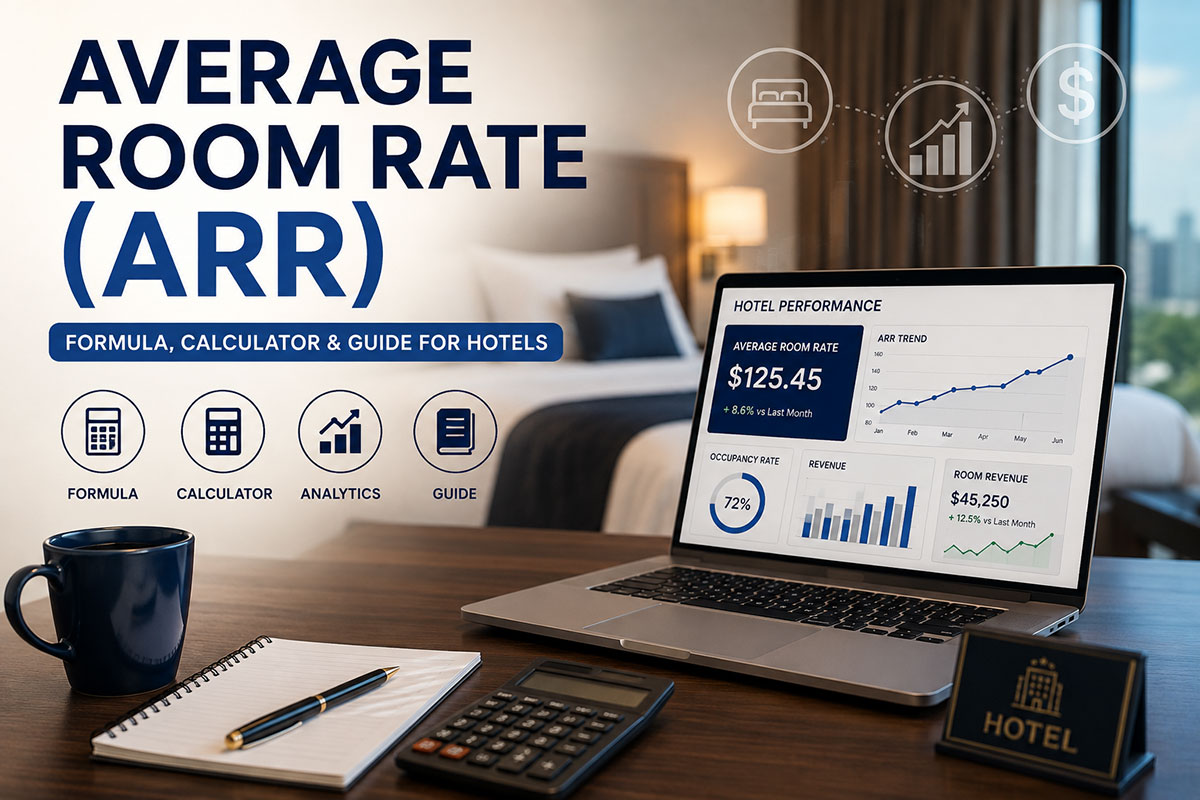
Average Room Rate (ARR) is the total room revenue divided by the total number of rooms sold during a specific period. It measures the average price your hotel earns per occupied room, excluding taxes, service charges, and non-room revenue like food & beverage. Hotels use ARR to evaluate pricing effectiveness, compare performance across periods, and benchmark against competitors. For example, if a 50-room hotel sells 350 rooms in a week and earns PKR 1,750,000 in room revenue, the ARR is PKR 5,000 (1,750,000 ÷ 350). Modern cloud-based hotel PMS software like EloPMS automatically calculates ARR daily, weekly, and monthly, eliminating manual Excel tracking.
What is Average Room Rate (ARR)?
Average Room Rate (ARR) is one of the essential indicators in the hospitality industry. It tells you, on average, how much room revenue you generate per occupied room over a given time period. Whether you run a 10-room boutique hotel or a 200-room resort, ARR is your pricing baseline — it shows what guests actually paid, not what your rack rate says they should pay.
Why ARR Matters
ARR gives you three critical insights:
- Pricing effectiveness — Are your rates aligned with market demand, or are you leaving money on the table (or pricing yourself out)?
- Performance tracking — Compare this week to last week, this month to last month, or this January to last January. ARR reveals seasonal trends and pricing momentum.
- Competitive benchmarking — When you know your ARR is PKR 4,500 and the boutique hotel down the street averages PKR 6,000, you have a clear signal: either justify your price gap with better value, or adjust your positioning.
ARR vs Rack Rate vs Published Rate
Hoteliers sometimes confuse ARR with other rate terms, so here's the clarification:
- Rack rate is the theoretical maximum price for a room type — the "sticker price" few guests pay.
- Published rate is what you advertise on your website or OTA listings.
- ARR is what guests actually paid on average, after all discounts, corporate rates, package deals, and promotional offers.
ARR reflects reality. A 100-room hotel with a PKR 8,000 rack rate might have an ARR of PKR 5,500 once you account for weekday corporate discounts, weekend packages, and OTA commission-driven rate cuts.
Modern cloud-based hotel management systems like EloPMS calculate ARR automatically in your reporting dashboard, so you always know your true pricing performance without manual spreadsheet work.
ARR Formula Explained
The ARR formula is straightforward:
ARR = Total Room Revenue ÷ Total Rooms Sold
When to Use ARR
You can calculate ARR for any period:
- Daily — useful for monitoring day-of-week pricing patterns (are Fridays stronger than Mondays?)
- Weekly — smooths daily volatility, better for trend spotting
- Monthly — the standard reporting period for most revenue managers
- Seasonal snapshots — compare peak season (December–February) to off-season (June–August) to measure pricing discipline
What to Include in "Room Revenue"
Only base room charges. Exclude:
- Food & beverage (restaurant, minibar, room service)
- Taxes and VAT
- Service charges
- Spa, laundry, tour bookings
- Refundable deposits
If a guest pays PKR 10,000 for a room, PKR 2,000 for dinner, and PKR 1,500 in taxes, only the PKR 10,000 counts toward room revenue for ARR calculation.
What to Include in "Rooms Sold"
Only occupied rooms where revenue was collected. Exclude:
- Complimentary stays (influencer freebies, owner's family)
- House-use rooms (blocked for maintenance, staff accommodation)
- No-show reservations that were canceled and refunded
If you have 100 rooms available, sell 80, comp 5 to a wedding party, and block 3 for painting, your "rooms sold" for ARR is 80, not 88.
How to Calculate ARR (Step-by-Step Examples)
Let's walk through three real-world scenarios — a city hotel, a boutique property, and a seasonal resort — to see ARR calculation in action.
Example 1: 100-Room City Hotel (Weekly ARR)
Property: Grand Pearl Hotel, Karachi — 100 rooms, business + leisure mix
Period: Monday through Sunday (7 days)
Data:
- Total room-nights available: 700 (100 rooms × 7 days)
- Rooms sold: 560 (80% occupancy)
- Total room revenue: PKR 2,800,000
ARR Calculation: ARR = 2,800,000 ÷ 560 = PKR 5,000
Takeaway: Even at 80% occupancy — a strong performance — the ARR shows the actual average revenue per sale was PKR 5,000. This number reflects the mix of rack-rate weekend bookings, discounted corporate weekday stays, and OTA commissions. The hotel's published rack rate might be PKR 7,000, but the working rate (ARR) is PKR 5,000. That gap is normal, but if it widens (say, ARR drops to PKR 4,200 while rack stays PKR 7,000), it signals over-discounting or heavy OTA dependency.
Example 2: 10-Room Boutique Hotel (Monthly ARR)
Property: Villa Serene, Murree — 10 rooms, boutique leisure hotel
Period: 31-day month (January)
Data:
- Total room-nights available: 310 (10 rooms × 31 days)
- Rooms sold: 217 (70% occupancy)
- Total room revenue: PKR 1,302,000
ARR Calculation: ARR = 1,302,000 ÷ 217 = PKR 6,000
Takeaway: Boutique hotels often command higher ARR than city hotels due to unique experiences, personalized service, and smaller inventory (scarcity premium). This property's PKR 6,000 ARR is 20% higher than the city hotel's PKR 5,000, even though occupancy is 10 percentage points lower (70% vs 80%). Revenue strategy for boutique properties balances exclusivity (higher ARR) with occupancy — you can't fill 70%+ every night at boutique pricing, and that's acceptable if ARR justifies the gap.
Example 3: 40-Room Resort (Seasonal ARR Variance)
Property: Blue Lagoon Resort, Nathia Gali — 40 rooms, mountain resort
Period: Two months compared (peak vs off-season)
Peak Season (January — winter tourism):
- Total room-nights available: 1,240 (40 rooms × 31 days)
- Rooms sold: 960 (77.4% occupancy)
- Total room revenue: PKR 7,680,000
- ARR = 7,680,000 ÷ 960 = PKR 8,000
Off-Season (July — monsoon, low demand):
- Total room-nights available: 1,240 (40 rooms × 31 days)
- Rooms sold: 372 (30% occupancy)
- Total room revenue: PKR 1,488,000
- ARR = 1,488,000 ÷ 372 = PKR 4,000
Takeaway: Seasonal properties experience dramatic ARR swings. This resort's peak ARR (PKR 8,000) is double its off-season ARR (PKR 4,000). That's a deliberate pricing strategy: premium rates during high-demand winter months, discounted rates to drive any occupancy during low-demand monsoon season. The key is to track year-over-year ARR in the same periods — compare January 2026 to January 2025, not January to July. If January ARR drops from PKR 8,000 (2025) to PKR 7,200 (2026) at similar occupancy, you've lost pricing power and need to investigate why (new competitor? weaker marketing? OTA over-reliance?).
ARR vs ADR vs RevPAR — What's the Difference?
Hoteliers encounter three similar acronyms: ARR, ADR, and RevPAR. They're related but measure different aspects of performance.
ARR (Average Room Rate)
Formula: Total room revenue ÷ Total rooms sold
What it measures: Average price per occupied room
When to use: Pricing effectiveness — did we sell rooms at strong rates, or did we discount too heavily?
ADR (Average Daily Rate)
Formula: Total room revenue ÷ Total rooms sold (same as ARR)
What it measures: Same as ARR, but emphasized as "per day per occupied room"
Note: ARR and ADR are often used interchangeably. Some hoteliers prefer "ADR" for daily snapshots and "ARR" for weekly or monthly periods, but the math is identical. In practice, if someone says "What's your ADR?", they're asking for your ARR. The terms are functionally synonymous.
RevPAR (Revenue per Available Room)
Formula: Total room revenue ÷ Total rooms available (includes unsold rooms)
Alternate formula: ADR × Occupancy Rate
What it measures: Revenue efficiency — how well you're monetizing your entire inventory, not just occupied rooms
Key difference: RevPAR penalizes low occupancy; ARR doesn't.
Comparison Table
| Metric | Formula | What it measures | When to use |
|---|---|---|---|
| ARR/ADR | Revenue ÷ Rooms sold | Average price per sale | Pricing effectiveness |
| RevPAR | Revenue ÷ Rooms available | Revenue efficiency | Occupancy + pricing combined |
Example to clarify:
A 50-room hotel sells 25 rooms (50% occupancy) at PKR 6,000 each.
- Room revenue: PKR 150,000
- ARR/ADR: 150,000 ÷ 25 = PKR 6,000
- RevPAR: 150,000 ÷ 50 = PKR 3,000 (or PKR 6,000 × 0.50 = PKR 3,000)
ARR tells you the hotel sold rooms at a strong PKR 6,000 average. RevPAR tells you the hotel only captured PKR 3,000 per room in total inventory because half the rooms sat empty. Both metrics matter. High ARR + low occupancy can mean you're overpriced. Low ARR + high occupancy can mean you're underpriced. The sweet spot is strong ARR at healthy occupancy — that's what maximizes RevPAR.
How to Track ARR in Your Hotel PMS
Manual Calculation (Excel or Paper)
You can calculate ARR manually:
- Pull a report of room revenue for the period (daily, weekly, monthly)
- Count how many rooms you sold (exclude comps and house-use)
- Divide revenue by rooms sold
This works for small properties (10–20 rooms), but it's time-consuming and error-prone. You need to remember to exclude taxes, F&B, and service charges. You need to track comps separately. And you need to do this every week or month to spot trends.
Automated Reporting (Cloud PMS)
Modern cloud-based hotel management systems like EloPMS calculate ARR automatically — daily, weekly, monthly — and display trends over time. The system knows which revenue is room-only (excludes F&B and taxes), tracks comps and house-use separately, and breaks ARR down by:
- Room type (standard vs suite vs deluxe)
- Booking source (direct vs OTA vs corporate vs walk-in)
- Property (for multi-property groups managing 3, 5, or 10 hotels from one dashboard)
Instead of spending 30 minutes in Excel every Monday, you open your reporting dashboard and see: "Last week ARR: PKR 5,200. Week before: PKR 4,950. Trend: +5%." That's actionable intelligence in 10 seconds.
Why Automation Matters
General Managers and Revenue Managers should spend time acting on data, not calculating it. If you're still doing manual ARR math in 2026, you're losing hours every month that could be spent on pricing strategy, marketing, guest experience, or revenue optimization. Cloud PMS automation isn't a luxury for large chains anymore — it's the baseline for any hotel that wants to compete on pricing and performance.
How to Improve Your Average Room Rate
ARR isn't static. It responds to pricing strategy, distribution discipline, and revenue tactics. Here are five practical strategies to increase your hotel's ARR without sacrificing occupancy.
Strategy 1: Dynamic Pricing (Adjust Rates Based on Demand)
Static rack rates are obsolete. Dynamic pricing means adjusting your room rates in real time based on:
- Demand signals (booking pace, occupancy forecast)
- Competitor rates (what's the hotel next door charging tonight?)
- Local events (concert at the arena, conference at the convention center, cricket match)
- Seasonality (winter peak, summer low, shoulder months)
- Day of week (Friday premium, Tuesday discount)
A well-executed dynamic pricing strategy can significantly improve ARR compared to static pricing. Business travelers tolerate 5–15% midweek rate adjustments; leisure guests tolerate 20–40% swings around events or weekends.
Most independent hotels in Pakistan still use manual rate adjustments (GM logs into the PMS and changes rates weekly). That's better than static pricing, but it's reactive. Cloud-based revenue management systems can automate dynamic pricing based on rules you set — raise rates 20% when occupancy hits 70%, drop rates 10% if Thursday is still 40% unsold by Monday, etc.
Strategy 2: Reduce OTA Reliance (Capture Full-Rate Direct Bookings)
OTAs (Booking.com, Agoda, Expedia) charge 15–30% commission, and they pressure hotels to offer discounted rates to win placement in search results. Every OTA booking erodes your ARR compared to a direct booking at the same published rate.
Example: A room listed at PKR 8,000 on your website and on Booking.com.
- Direct booking: You keep PKR 8,000 (100%)
- OTA booking: You pay 18% commission (PKR 1,440), net PKR 6,560 (82%)
If 60% of your bookings come via OTA, your ARR is suppressed by that commission drag. The fix: install a commission-free booking engine on your website, offer a best-rate guarantee for direct bookers (book direct, get 10% off or a free breakfast), and capture guest emails at check-in to nurture repeat direct bookings.
Stop bleeding OTA commissions — every direct booking you shift from Booking.com to your own site lifts your effective ARR by the commission you no longer pay.
Strategy 3: Upsell Room Types (Push Premium Inventory)
When standard rooms hit 70–80% sold, stop selling them at base rates. Redirect demand to suites, deluxe rooms, or premium categories at higher ARR. Train your front desk and reservations team to upsell:
- "Our last two standard rooms are available at PKR 6,000, or I can offer you a deluxe room with a mountain view for PKR 7,500."
- "For PKR 1,500 more, you'll get 30% more space, a balcony, and complimentary late checkout."
Upselling doesn't just increase ARR on the upgraded booking — it also preserves standard inventory for last-minute high-rate bookings (walk-ins who need a room tonight and will pay rack rate).
Strategy 4: Package Deals That Increase Perceived Value
Packages allow you to maintain or raise base ARR while adding perceived value. Instead of discounting a PKR 8,000 room to PKR 7,000, offer a "Romance Package" at PKR 8,500 that includes the room + a bottle of wine + late checkout. The guest perceives PKR 1,000+ in added value; you spent PKR 500 on wine and gave away a late checkout that costs you nothing if occupancy is low.
Packages protect ARR from erosion while giving you a competitive edge over hotels that compete purely on price.
Strategy 5: Track Competitor Rates and Position Strategically
You can't set pricing in a vacuum. If every hotel in your market charges PKR 5,000–6,000 for a similar room and you're charging PKR 8,000, you'll struggle with occupancy. If you're charging PKR 4,000, you're leaving money on the table.
Use a rate-shopping tool (manual check of competitor websites weekly, or automated tools if available) to understand your competitive position. Then decide:
- Premium positioning: Charge 10–15% above market average, justified by superior location, service, or amenities
- Market-rate positioning: Match the average, compete on service and reputation
- Value positioning: Charge 10–15% below market, compete on price for budget-conscious segments
The worst strategy is to ignore competitor rates and assume your pricing is correct. Market dynamics change — a new competitor opens, a major hotel renovates, an OTA shifts its algorithm — and your ARR suffers if you're not monitoring and adapting.
Common ARR Mistakes to Avoid
Mistake 1: Including Taxes and Service Charges in Room Revenue
ARR should reflect pre-tax, pre-service-charge room revenue. If a guest pays PKR 10,000 for a room + PKR 1,500 VAT + PKR 500 service charge, the room revenue is PKR 10,000, not PKR 12,000. Including taxes inflates your ARR incorrectly and makes period-to-period comparisons unreliable (tax rates change, service charges vary by booking source).
Mistake 2: Including Complimentary or Staff Rooms in Denominator
If you comp 10 rooms to a wedding group, those 10 rooms should not appear in "rooms sold" for ARR calculation. They generated zero revenue. Including them drags your ARR down artificially. Same for house-use rooms (staff accommodation, blocked for maintenance) — exclude them from both numerator and denominator.
Mistake 3: Comparing ARR Across Different Markets Without Context
A boutique hotel in Hunza with ARR of PKR 12,000 isn't "better" than a budget hotel in Faisalabad with ARR of PKR 3,500. They serve different markets. Boutique leisure properties command higher ARR due to scarcity, experience, and positioning. Budget business hotels optimize for volume and occupancy. Compare your ARR to competitors in your segment and location, not to hotels in different categories.
Mistake 4: Focusing Only on ARR Without Tracking Occupancy
High ARR means nothing if occupancy is 30%. You might be pricing yourself out of the market. Conversely, 95% occupancy with low ARR means you're underpriced and leaving revenue on the table. The key is to track ARR and occupancy together — and ideally, RevPAR, which combines both — to understand your true revenue performance.
A healthy hotel balances strong ARR with sustainable occupancy. For most independent hotels, that means 65–80% occupancy with ARR that reflects your positioning (premium, mid-market, or budget).
Ready to Automate Your Hotel Revenue Reporting?
EloPMS calculates ARR, RevPAR, occupancy, and 60+ other reports automatically — no spreadsheets, no manual math. See real-time ARR trends by room type, booking source, and property (for multi-property groups), all in one cloud-based dashboard. Stop spending hours in Excel and start making faster, smarter pricing decisions.
Start your free trial or schedule a demo to see how EloPMS can transform your hotel's revenue management.